library(data.table)
library(stringr)
library(ggplot2)
library(grid)
library(directlabels)
stackoverflow <- fread("https://data.stackexchange.com/stackoverflow/csv/440417")
stackoverflow[,`:=`(Month=as.Date(str_extract(Month, "\\d{4}-\\d{2}-\\d{2}")),
Questions = as.numeric(Questions))]
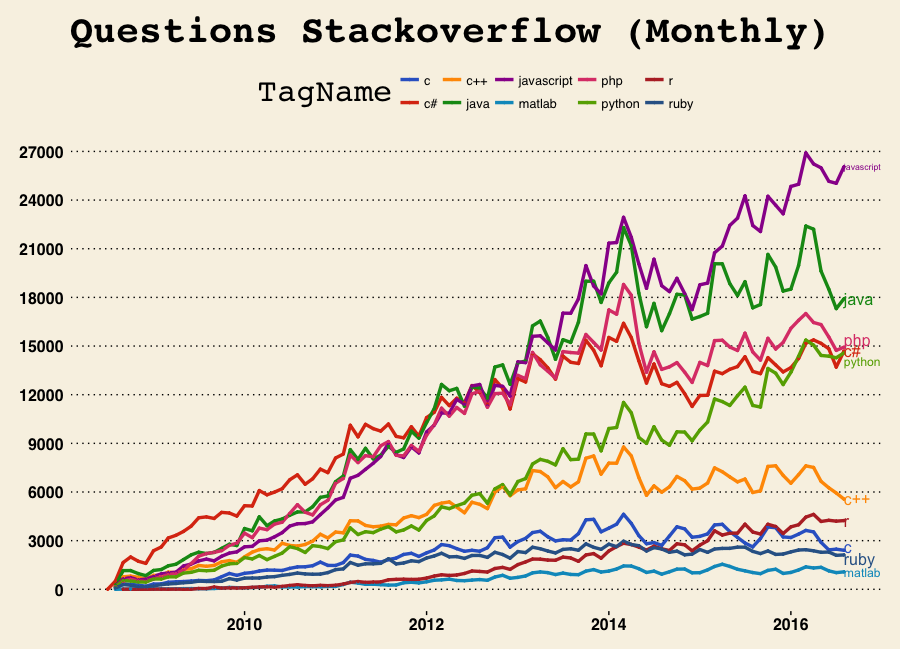
p = ggplot(stackoverflow)+
geom_line(aes(x = Month, y = Questions, colour = TagName),size = 1.2)+
geom_point(size = 0.5,aes(x = Month, y = Questions,colour = TagName))+
ggthemes::scale_colour_gdocs()+
ggthemes::theme_wsj()+
scale_y_continuous(breaks = seq(0, 30000, 3000))+
geom_dl(aes(x = Month, y = Questions,label = TagName, colour = TagName), method = list("last.qp"))+
ggtitle("Questions Stackoverflow (Monthly) ")
p